


An LED display quotation shows the purchase price, but it does not show what the screen will cost to install, power, maintain, repair, and keep available over its working life. For commercial buyers, those additional costs can change the preferred technology, supplier, and specification.
This guide provides a practical five-year total cost of ownership model for direct-view LED displays. It explains which costs belong in the calculation, how to estimate energy and downtime, and how to compare LED with LCD video walls and projection systems using the same operating assumptions. All monetary examples are illustrative. Buyers should replace them with local quotations, electricity tariffs, labor rates, tax treatment, and service-level requirements.

What Is LED Display Total Cost of Ownership
Total cost of ownership, or TCO, is the full cost of acquiring and operating a display during a defined analysis period. A five-year period is useful for budget planning because it is long enough to expose energy, service, and downtime differences without assuming that every component will remain unchanged for a decade.
The calculation should include capital expenditure, implementation costs, recurring operating costs, risk-related costs, and any residual value. It should also use the same screen size, operating schedule, brightness target, service requirement, and content workflow for every alternative.
A simple model is:
Five Year TCO = Acquisition + Installation + Energy + Maintenance + Spares + Downtime + Content and Control Costs – Residual Value
This formula is more useful than comparing hardware quotations because low-priced equipment can become expensive when it consumes more electricity, needs frequent technician visits, or cannot obtain compatible spare modules quickly.
The Cost Categories Buyers Should Include
Start With a Normalized Project Definition
A fair TCO comparison begins with one project definition. If one supplier prices a brighter screen, a finer pixel pitch, more redundancy, or a longer warranty, its higher quotation is not directly comparable with a lower specification. Define the operating requirement before collecting costs.
| Cost category | What to include | Common omission |
|---|---|---|
| Acquisition | LED modules or cabinets, controller, processor, power distribution, mounting and standard spares | Quotations with different controller or spare-parts scopes |
| Installation | Structure, labor, lifting, cabling, commissioning, calibration, permits and site restoration | Night work, access equipment and final calibration |
| Energy | Display load, control equipment, cooling and standby consumption | Using maximum power as if it were average power |
| Maintenance | Inspection, cleaning, calibration, preventive service and technician travel | Travel time and access equipment |
| Corrective repair | Replacement modules, power supplies, receiving cards, connectors and labor | Failure investigation and repeat visits |
| Downtime | Lost advertising, disrupted operations, substitute equipment and contractual penalties | The business value of availability |
| Content and control | Licenses, players, network service, content adaptation and operator labor | Recurring software and support charges |
| End of term | Removal, disposal, relocation and remaining asset value | Deinstallation and structural restoration |
- Visible screen dimensions and native resolution
- Indoor or outdoor environment and target operating brightness
- Daily operating hours and annual operating days
- Typical content mix and average picture level
- Required availability and maximum acceptable repair time
- Front or rear service access and lifting requirements
- Camera, refresh-rate, color, redundancy, and control-system requirements
- Analysis period, discount rate, electricity escalation assumption, and currency
Do not normalize by deleting necessary functions. Instead, price the same required outcome for every option. If redundancy is essential for a control room, include it in all suitable alternatives rather than treating it as an LED-only premium.
How to Calculate Five Year Energy Cost
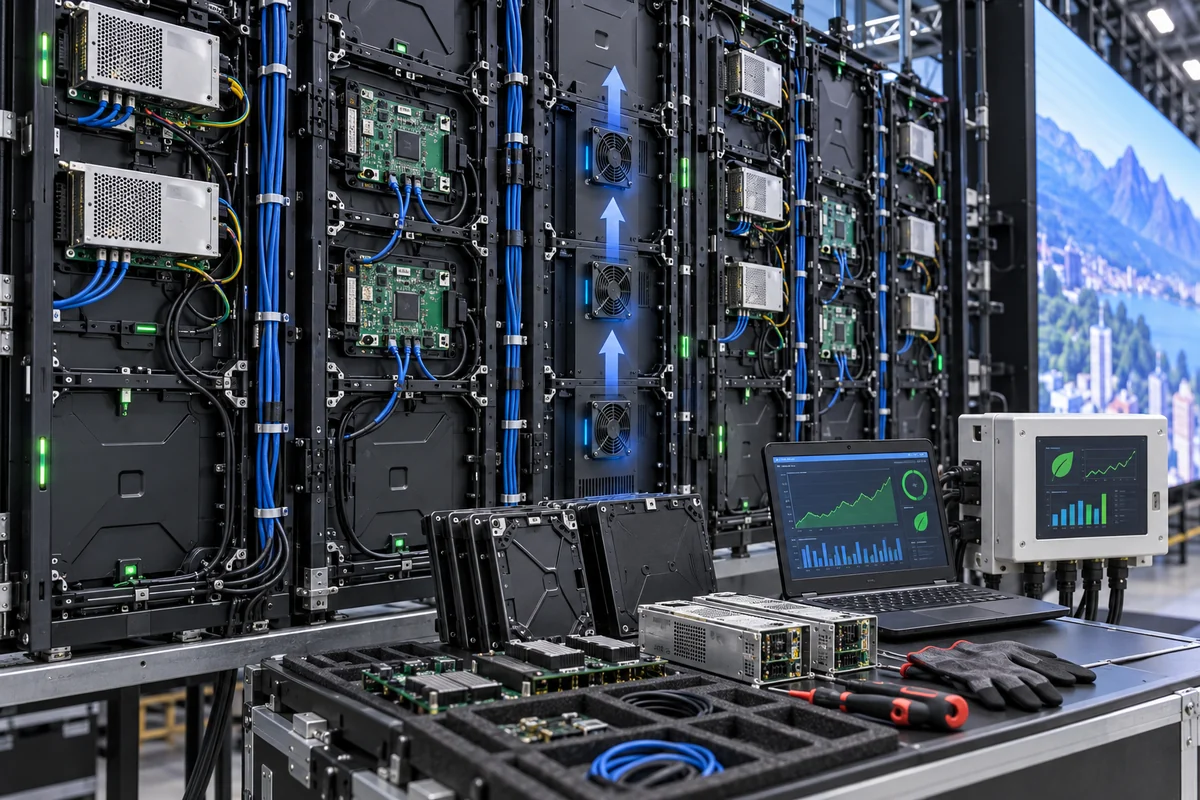
Energy cost depends on actual electrical load, not screen area alone. An LED display changes consumption with content, brightness, driver efficiency, power-supply efficiency, and temperature. Maximum power is useful for circuit design, but average power is normally more appropriate for operating-cost estimates.
Annual Energy Cost = Average Load in kW x Hours per Day x Operating Days x Electricity Price per kWh
If the screen requires dedicated cooling, add the estimated HVAC energy separately. For outdoor installations, also include ventilation, heaters, or dehumidification where applicable. Request both maximum and typical measured load from the supplier and document the brightness and test content used for that measurement.
Illustrative Energy Example
Assume a 24 m2 indoor LED wall operates 12 hours per day, 365 days per year. The supplier estimates an average display load of 4.8 kW at the planned brightness, and the local electricity price is USD 0.16 per kWh.
| Calculation | Formula | Illustrative result |
|---|---|---|
| Annual operating hours | 12 x 365 | 4,380 hours |
| Annual electricity use | 4.8 kW x 4,380 hours | 21,024 kWh |
| Annual display energy cost | 21,024 kWh x USD 0.16 | USD 3,363.84 |
| Five-year energy cost before escalation | USD 3,363.84 x 5 | USD 16,819.20 |
This example excludes cooling and electricity-price escalation. It also assumes the average load remains stable. A sensitivity range is preferable when operating brightness or content is uncertain.
Maintenance and Spare Parts Model
LED displays are modular, which allows a technician to replace a module, power supply, receiving card, or cable instead of replacing the entire display. That serviceability can reduce repair cost, but only when technicians can reach the components and compatible spares remain available.
| Asset or activity | Budget method | Planning question |
|---|---|---|
| LED modules | Quantity based on screen size, module type and acceptable repair time | Will replacement modules match the original LED batch and calibration? |
| Power supplies | Failure allowance plus critical on-site stock | Can the unit be replaced without removing multiple cabinets? |
| Receiving cards | Configured spares for rapid swap | Are firmware and configuration files backed up? |
| Preventive visits | Visits per year x labor, travel and access cost | Does the site require night work or a lift? |
| Calibration | Scheduled allowance or condition-based service | Is camera or brand-color consistency contractually important? |
A five-year budget should separate planned maintenance from corrective repair. Planned maintenance includes inspection, cleaning, connection checks, backups, calibration verification, waterproofing inspection, and fan or filter service. Corrective repair covers failed components, fault diagnosis, access equipment, technician labor, and return visits.
The spare-parts allowance should follow project criticality rather than a universal percentage. A single lobby screen may tolerate a longer repair window. A broadcast studio, command center, or transport information display may require on-site modules, receiving cards, power supplies, cables, and a configured backup controller.
Downtime Can Cost More Than the Repair
Downtime cost is often omitted because it does not appear on the equipment invoice. For an advertising display, downtime can mean lost media revenue or service credits. For a control room, it can affect operational decisions. For a retail flagship, it can disrupt a campaign and damage the intended customer experience.
Expected Annual Downtime Cost = Failure Events x Average Hours per Event x Business Cost per Hour
Use a reasonable range instead of an invented precise number. Calculate low, expected, and high cases based on the site’s operating records or contractual exposure. Then test whether redundancy, remote monitoring, local spares, or a faster service agreement reduces more expected cost than it adds.
Availability is a system property. A premium LED module does not prevent downtime caused by a single controller, power-distribution fault, unsupported media player, or inaccessible service area. The TCO model should therefore evaluate the complete signal, power, structural, and support design.
A Five Year LED Display Cost Model
The following example demonstrates the structure of a TCO calculation for a commercial LED wall. It is not a market price quotation. Replace every value with project-specific data and keep the assumptions attached to the result.
| Cost item | Year 0 | Years 1 to 5 | Five-year total |
|---|---|---|---|
| Display and control hardware | USD 96,000 | – | USD 96,000 |
| Structure, installation and commissioning | USD 22,000 | – | USD 22,000 |
| Initial spare parts | USD 4,800 | – | USD 4,800 |
| Electricity | – | USD 3,364 per year | USD 16,820 |
| Preventive maintenance | – | USD 1,800 per year | USD 9,000 |
| Corrective repair allowance | – | USD 1,200 per year | USD 6,000 |
| Software and network service | USD 1,500 | USD 900 per year | USD 6,000 |
| Expected downtime impact | – | USD 1,000 per year | USD 5,000 |
| Removal less residual value | – | End of year 5 | USD 2,500 |
| Illustrative five-year TCO | USD 168,120 |
In this example, the hardware quotation represents only 57% of five-year TCO. The percentage will change by project. Screens with long daily schedules are more sensitive to electricity, while mission-critical installations are more sensitive to availability, redundancy, and response time.
Use Sensitivity Analysis Instead of One Number
A single TCO result can create false confidence. Several inputs are uncertain at the purchasing stage, including electricity price, average brightness, failure frequency, labor cost, and the value of downtime. A simple sensitivity table shows which assumption could change the decision.
| Variable | Low case | Expected case | High case |
|---|---|---|---|
| Average electrical load | 3.8 kW | 4.8 kW | 5.8 kW |
| Electricity price | USD 0.12 per kWh | USD 0.16 per kWh | USD 0.22 per kWh |
| Corrective service | USD 600 per year | USD 1,200 per year | USD 2,500 per year |
| Downtime impact | USD 250 per year | USD 1,000 per year | USD 5,000 per year |
| Residual value | USD 5,000 | USD 2,500 | USD 0 |
If a different supplier becomes preferable after a small change in one assumption, the purchasing decision is sensitive and needs better evidence. Request measured power data, service records, spare-parts commitments, and response-time terms before final approval.
Comparing LED With LCD Video Walls and Projection

A technology comparison must use the same image size, ambient-light condition, resolution requirement, operating schedule, and availability target. Otherwise, it compares unlike outcomes. LED often performs well for large seamless images, high brightness, custom dimensions, and modular repair. LCD may be economical for smaller close-viewing applications where bezels are acceptable. Projection may offer a low initial cost when ambient light can be controlled and equipment placement is practical.
| Decision factor | Direct-view LED | LCD video wall | Laser projection |
|---|---|---|---|
| Initial equipment cost | Often highest | Moderate for standard sizes | Often lowest for large image size |
| Image continuity | Seamless when aligned correctly | Panel bezels remain visible | No panel seams |
| Ambient-light performance | Strong when correctly specified | Good indoors | Depends heavily on room control |
| Service unit | Module or component | Usually complete panel or internal assembly | Projector, lens, filter or optical unit |
| Custom size and shape | High flexibility | Constrained by panel geometry | Flexible image size within optical limits |
| Primary TCO sensitivity | Energy, spares, access and control system | Panel replacement and bezel consistency | Light source, filters, alignment and room conditions |
Do not assume LED automatically has the lowest five-year TCO. Its economic advantage becomes stronger when seamless scale, brightness, long operating hours, modular repair, or architectural flexibility have real business value. For a small room with controlled light and a limited duty cycle, LCD or projection may remain the more economical solution.
When an LED Display Is Not the Right Choice
A responsible TCO analysis should be able to reject LED. The technology may be difficult to justify when the required image is small, the viewing distance is extremely close, the room is dark and used infrequently, the budget cannot support appropriate pixel density, or the organization cannot maintain spare modules and configuration files.
- Choose an LCD display when a standard panel size satisfies the viewing area and close-range text density matters more than seamless scale.
- Consider projection when the room can control ambient light, a very large temporary image is needed, and mounting geometry is suitable.
- Delay procurement when power, structure, service access, heat management, or content ownership has not been defined.
- Do not buy a finer pixel pitch only to improve the specification sheet when the viewing distance cannot reveal the added density.
- Do not accept a low quotation that omits controller capacity, installation structure, calibration, spares, or after-sales response.
How Manufacturing Decisions Change TCO
Displays with similar headline specifications can produce different operating costs. LED bin consistency affects calibration and replacement-module matching. Driver IC efficiency influences heat and low-gray performance. PCB design, solder quality, power distribution, connector selection, cabinet precision, and waterproofing influence failure frequency and service time.
Factory aging tests are useful when their conditions are documented. Buyers should ask what duration, brightness, temperature, test patterns, and inspection criteria were used. An aging period that only confirms the screen can remain powered on is less informative than a process that records dead pixels, thermal behavior, color consistency, voltage stability, and intermittent connections.
Supplier continuity also belongs in the cost model. A display can remain electrically functional yet become expensive to maintain if replacement modules, receiving cards, configuration files, or technical support are unavailable. Contractual commitments for spare-part compatibility, documentation, and response time can reduce this risk.
Questions to Ask Every Supplier
- What is included and excluded from the quotation, including control, structure, commissioning, calibration and spares?
- What maximum and typical power figures were measured, and at what brightness and content?
- Which LED package, driver IC, power supply, receiving card and cabinet design are proposed?
- How will replacement modules be matched after two, three or five years?
- Which configuration and calibration files will be handed over?
- What preventive maintenance schedule and on-site spare stock are recommended?
- What are the warranty exclusions, response times and labor responsibilities?
- Can the supplier provide a five-year parts and support commitment?
- Which tests are completed before shipment, and which results are documented?
- What service access, tools, lifting equipment and shutdown windows will the site require?
LED Display TCO Frequently Asked Questions
Is the lowest LED display quotation usually the lowest cost option
No. A lower quotation may exclude installation, control equipment, calibration, spare parts, warranty labor, or service access. Compare the same project scope and calculate recurring costs before selecting a supplier.
Should maximum power be used for the energy budget
Use maximum power for electrical capacity and protection design. For operating-cost estimates, use a measured or defensible average load at the planned brightness and content mix, then test a higher-load sensitivity case.
How much should a buyer budget for spare parts
There is no universal percentage. The quantity depends on screen size, component lead time, project criticality, acceptable repair time, product continuity, and whether the site can store matched modules safely.
How should downtime be valued
Estimate the hourly business impact and expected duration of service interruptions. Advertising revenue, operational disruption, substitute equipment, contractual penalties, and brand exposure may all be relevant. Use a documented range when the value is uncertain.
Does LED always cost less than LCD or projection over five years
No. LED becomes more competitive when the project values seamless scale, brightness, long operating hours, modular repair, or custom geometry. Smaller or lightly used installations may favor LCD or projection.
Conclusion
A five-year LED display decision should be based on the cost of delivering an available, maintainable image rather than the equipment price alone. The useful model includes acquisition, implementation, energy, maintenance, spares, downtime, content systems, and end-of-term cost under one normalized project definition.
The calculation does not need to predict every failure precisely. Its purpose is to expose assumptions, compare alternatives consistently, and identify the variables that deserve better evidence. When suppliers provide measured power data, transparent component specifications, service commitments, and practical spare-parts planning, buyers can select a display system that balances visual performance with long-term financial risk.
For a project-specific TCO review, prepare the screen dimensions, operating schedule, electricity rate, installation conditions, required availability, service access, and local labor costs before requesting a final proposal from NSELED.