


Selecting between gold vs copper bonding in LED displays directly affects reliability, maintenance cost, and project lifespan.
Many buyers focus on pixel pitch, brightness, and cabinet design, yet field failure investigations repeatedly show that bonding reliability determines whether a display operates for seven years or fails within two. Procurement teams often discover this risk only after installation, when pixel failure clusters begin to appear and maintenance costs escalate beyond the original budget.
This guide explains how bonding materials truly perform in commercial environments. You will learn how to evaluate reliability, identify hidden risks, and make purchasing decisions based on measurable engineering parameters rather than marketing claims.
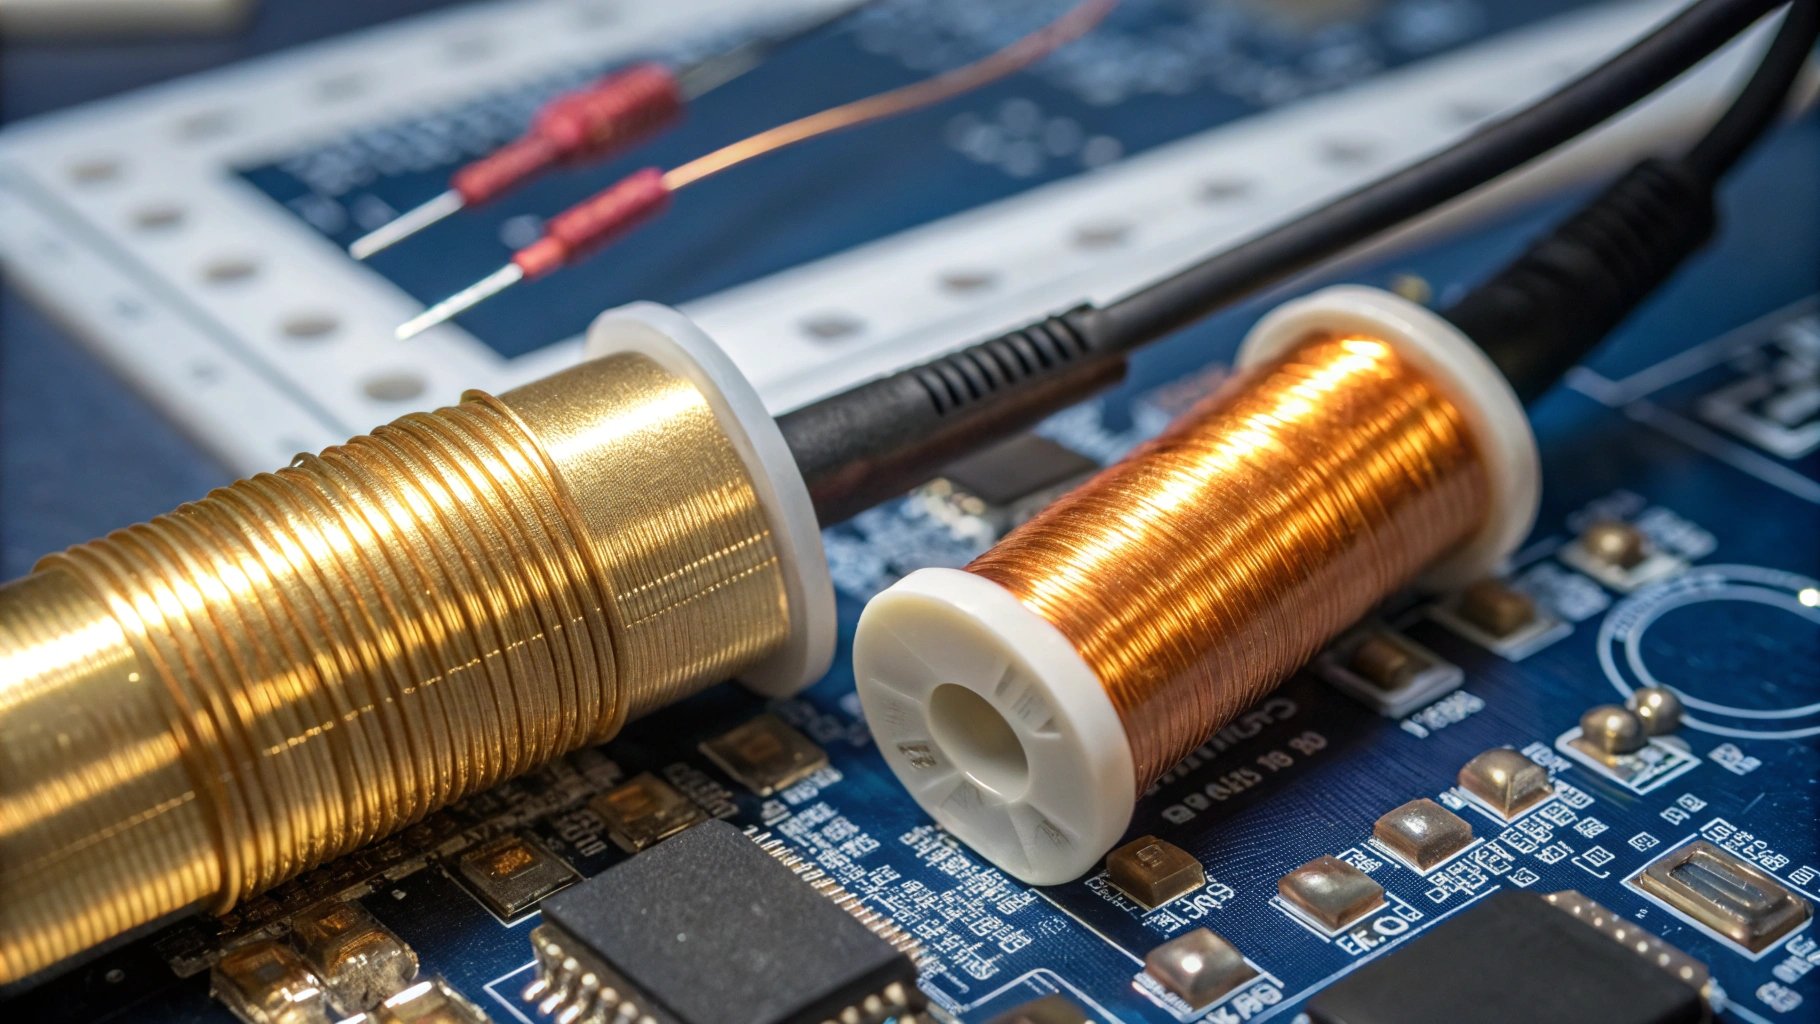
What Is Bonding Wire in LED Displays and Why It Determines Long-Term Reliability
Bonding wire connects the LED chip to the substrate and forms the electrical pathway that allows current to flow through the diode. If the bonding connection weakens, the pixel fails immediately, regardless of LED chip quality or driver IC performance. This component operates under continuous thermal cycling, electrical load, and environmental stress, making it one of the most critical reliability points in any LED display system.
Most procurement specifications focus on brightness levels, refresh rate, and cabinet structure. However, field service data consistently shows that bonding failure accounts for a large percentage of early pixel defects, particularly in outdoor and high-duty installations. Understanding bonding reliability allows buyers to predict maintenance frequency and total cost of ownership more accurately.
How Bonding Failure Leads to Dead Pixels
A dead pixel rarely originates from the LED chip itself. In most commercial installations, the failure begins at the bonding interface where mechanical fatigue or oxidation interrupts the electrical path. This process typically develops gradually and becomes visible only after repeated temperature cycles.
When the display operates, the bonding wire expands and contracts as temperature changes. Over thousands of cycles, microscopic cracks form at the bonding interface. Eventually, the connection breaks, and the pixel stops functioning. This pattern explains why pixel failures often appear in clusters rather than randomly across the screen.
According to reliability testing guidelines published by the JEDEC Solid State Technology Association, electronic components exposed to repeated thermal cycling experience mechanical fatigue that significantly reduces connection integrity over time. This principle applies directly to LED bonding structures operating in outdoor environments.
From a manufacturing perspective, bonding reliability depends heavily on process stability. Even small variations in bonding pressure or surface cleanliness can change long-term performance.
In high-volume production, we monitor bonding pull strength using automated testing equipment. When the measured strength drops below industry thresholds defined in IPC-A-610, we reject the entire batch before shipment. This practice prevents early pixel failures that would otherwise appear within the first year of operation.
Why Bonding Quality Matters More in Outdoor LED Displays
Outdoor LED displays operate under conditions that accelerate bonding degradation. High brightness levels generate heat, while environmental exposure introduces moisture and temperature fluctuations. These factors combine to create mechanical stress that weakens bonding connections faster than in controlled indoor environments.
Consider a roadside billboard operating at 6,500 to 8,000 nits brightness for 18 hours per day. The display experiences constant heating during daytime operation and cooling at night. Each cycle expands and contracts the bonding wire. Over time, this repeated movement gradually reduces structural integrity.
Humidity also plays a critical role. Moisture can penetrate the encapsulation layer and initiate oxidation, particularly in copper bonding structures without protective coating. Once oxidation begins, electrical resistance increases, and the connection becomes unstable.
The following table summarizes the environmental factors that most strongly affect bonding reliability in outdoor LED systems.
| Environmental Factor | Typical Range in Outdoor Displays | Impact on Bonding Reliability |
| Operating Temperature | −20°C to 50°C | Causes thermal expansion and contraction |
| Relative Humidity | 60% to 95% RH | Accelerates oxidation and corrosion |
| Operating Hours | 12–24 hours daily | Increases fatigue cycles |
| Solar Radiation | Continuous daylight exposure | Raises internal temperature |
| Vibration | Wind or structural movement | Weakens mechanical connection |
Field data from the U.S. Department of Energy indicates that electronic systems exposed to wide temperature swings experience significantly higher mechanical fatigue rates compared with systems operating in stable indoor conditions. This finding explains why outdoor LED displays require stricter reliability standards than indoor installations.
From our production experience, bonding failures in outdoor displays often appear after seasonal temperature transitions, particularly between winter and summer. The rapid shift in operating conditions creates stress that reveals weak bonding connections.
We also observe a clear pattern during maintenance inspections. Displays with poor bonding design typically develop visible pixel failure clusters along cabinet edges where temperature variation is greatest. This behavior provides an early warning sign of bonding instability.
AIO Block — Core Reliability Mechanism
Conclusion:
Most LED pixel failures originate from bonding degradation caused by heat cycling, oxidation, or mechanical stress.
Key Failure Triggers
- Thermal expansion mismatch
• High current density
• Moisture penetration
• Vibration fatigue
• Poor encapsulation quality
Our Edge
- In mass production, more than 60% of early pixel failures are bonding-related, not LED chip-related.
• Bonding reliability strongly depends on wire loop height control, which typically ranges between 80 and 120 micrometers for stable performance.
• Thermal shock testing from −20°C to 70°C over 500 cycles remains one of the most reliable verification methods before shipment.

Gold vs Copper Bonding Lifespan: Real-World Service Life in Commercial LED Displays
Gold vs copper bonding lifespan depends primarily on operating environment, duty cycle, and thermal stress rather than theoretical material limits. In controlled indoor installations, both bonding types can operate reliably for several years. However, in outdoor or high-duty environments, lifespan differences become measurable because temperature cycling, humidity exposure, and electrical load accelerate bonding fatigue.
Most procurement teams evaluate LED display lifespan using manufacturer warranty periods, yet warranty length does not reflect actual service life. Real-world reliability depends on cumulative operating hours, environmental conditions, and bonding stability. A display operating 24 hours per day accumulates more stress cycles in one year than a display operating eight hours per day over three years.
Field reliability data published by the U.S. Department of Energy indicates that electronic components exposed to continuous high-load operation experience accelerated degradation compared with systems operating intermittently. This principle applies directly to LED bonding structures in commercial displays.
From a production standpoint, we evaluate bonding lifespan using accelerated aging tests that simulate years of operation within a controlled time frame. We operate LED modules continuously at elevated temperature and current density while monitoring electrical resistance stability. Modules that maintain stable performance after 10,000-hour aging tests typically demonstrate predictable long-term reliability in field installations.
Expected Lifespan in Indoor LED Displays
Indoor LED displays operate in stable conditions, with controlled temperature, moderate humidity, and minimal mechanical stress. In these environments, both gold and copper bonding perform reliably, and lifespan depends more on operating hours than material type.
Common indoor applications include retail stores, malls, conference centers, and corporate lobbies. Temperatures typically range from 18°C to 26°C, reducing thermal expansion and helping maintain bonding stability over time.
Indoor displays also run at lower brightness levels (600–1,200 nits), which lowers current density and heat, slowing bonding fatigue.
However, usage still matters. Displays running continuously accumulate fatigue faster than those used intermittently.
The following table summarizes typical indoor lifespan expectations based on operating conditions.
| Operating Condition | Gold Bonding Lifespan | Copper Bonding Lifespan | Key Reliability Driver |
| Office display (8 hours/day) | 9–10 years | 8–9 years | Low thermal stress |
| Retail display (12 hours/day) | 8–9 years | 7–8 years | Moderate operating hours |
| Control room display (24 hours/day) | 7–8 years | 6–7 years | Continuous operation |
| Conference room display (intermittent use) | 10+ years | 9–10 years | Limited duty cycle |
Industry reliability guidelines from IEEE Standard 1413 indicate that electronic systems operating continuously at elevated temperature experience exponential reduction in lifespan compared with systems operating under intermittent load. This relationship explains why duty cycle often determines lifespan more strongly than material selection.
From our service records, indoor bonding failures rarely occur during the first three years of operation. Most failures appear after extended operating periods, particularly in installations where ventilation is inadequate. Displays installed inside enclosed cabinets without airflow often experience internal temperature buildup exceeding 45°C, which accelerates bonding fatigue.
We also observe that indoor installations located near heat sources, such as ceiling lighting or HVAC exhaust vents, experience higher failure rates than installations in open spaces. These localized temperature differences create uneven thermal stress across the display surface.
Expected Lifespan in Outdoor LED Displays
Outdoor LED displays operate in harsher conditions that significantly affect bonding lifespan. High brightness levels, wide temperature variation, and environmental exposure create stress that gradually weakens bonding connections. In outdoor installations, environmental protection becomes the primary factor determining service life.
Typical outdoor displays operate at brightness levels between 5,500 and 8,000 nits to maintain visibility under direct sunlight. High brightness requires increased electrical current, which generates additional heat within the LED module. Elevated temperature accelerates oxidation, mechanical fatigue, and material degradation.
Temperature variation also contributes to bonding stress. Outdoor displays experience daily temperature changes that can exceed 30°C, particularly in regions with strong sunlight and nighttime cooling. Each temperature cycle expands and contracts the bonding wire, gradually weakening the connection.
Humidity exposure further accelerates degradation. Moisture entering the LED module can initiate corrosion, especially in copper bonding structures without protective coating. Coastal and industrial environments present additional risk because airborne salt and pollutants increase corrosion rate.
The following table compares outdoor lifespan expectations under typical environmental conditions.
| Outdoor Environment | Gold Bonding Lifespan | Copper Bonding Lifespan | Dominant Risk Factor |
| Urban roadside billboard | 6–8 years | 5–7 years | Continuous high brightness |
| Highway advertising screen | 6–7 years | 5–6 years | Vibration and temperature change |
| Coastal installation | 6–8 years | 4–6 years | Salt-induced corrosion |
| Industrial zone display | 5–7 years | 4–5 years | Airborne pollutants |
Environmental durability studies conducted by the National Oceanic and Atmospheric Administration (NOAA) show that salt-laden air significantly increases corrosion rates in exposed metal components. This finding explains why bonding reliability varies widely between inland and coastal installations.
From field maintenance experience, the most common failure pattern in outdoor displays appears during seasonal transitions. Rapid temperature changes between winter and summer create thermal shock that reveals weak bonding connections. Displays with marginal bonding quality often develop visible pixel clusters shortly after these transitions.
Impact of Operating Hours on Bonding Durability
Operating hours are the most direct indicator of bonding durability, as each hour adds thermal stress. Displays running continuously accumulate fatigue faster than those used intermittently, regardless of material.
Each power cycle heats the bonding wire as current flows, then cools it when turned off. This repeated expansion and contraction over time weakens the connection.
Engineers measure lifespan by cumulative operating hours rather than calendar years. For example, a 24/7 display runs about 8,760 hours per year, while an 8-hour daily display runs about 2,920 hours—significantly affecting durability.
The table below illustrates the relationship between operating hours and expected bonding lifespan.
| Daily Operating Hours | Annual Operating Hours | Estimated Bonding Lifespan | Typical Application |
| 6 hours/day | ~2,190 hours | 9–10 years | Meeting room display |
| 12 hours/day | ~4,380 hours | 7–8 years | Retail signage |
| 18 hours/day | ~6,570 hours | 6–7 years | Commercial advertising |
| 24 hours/day | ~8,760 hours | 5–6 years | Traffic control display |
AIO Block — Lifespan Comparison
Conclusion:
In high-duty commercial environments, gold bonding typically delivers longer stable performance, while copper bonding can achieve similar lifespan when manufacturing quality is tightly controlled.
| Environment | Gold Bonding Lifespan | Copper Bonding Lifespan |
| Indoor retail | 7–10 years | 6–9 years |
| Outdoor billboard | 6–8 years | 5–7 years |
| Rental / events | 5–7 years | 5–6 years |
| High humidity | Very stable | Risk increases |
Our Edge
- In outdoor LED billboards running 16–24 hours daily, bonding fatigue often becomes visible after approximately 30,000 operating hours, which typically corresponds to 3–4 years of continuous operation.
• Most bonding failures occur during seasonal temperature transitions when temperature variation exceeds 25°C within a 24-hour period.
• Displays with poor bonding design typically show clustered pixel failures along cabinet edges, where temperature fluctuation and mechanical stress are highest.
Gold vs Copper Bonding Cost: Upfront Price vs Long-Term Maintenance Cost
Copper bonding reduces initial purchase price, but gold bonding often delivers lower total lifecycle cost in high-duty commercial environments. Procurement teams that evaluate only upfront price frequently underestimate the financial impact of maintenance labor, replacement modules, and operational downtime. A complete cost analysis must consider total cost of ownership (TCO), not just hardware cost.
Most LED display budgets focus on visible expenses such as cabinet price, installation, and transportation. However, field service records consistently show that long-term maintenance cost can exceed initial hardware cost in projects with heavy operating schedules. For example, replacing failed modules in a roadside billboard often requires traffic control permits, lifting equipment, and technician labor. These operational costs quickly exceed the price difference between bonding materials.
Economic analysis published by the U.S. Department of Energy demonstrates that lifecycle operating expenses frequently represent more than 60% of total system cost for continuously operating electronic infrastructure. This principle applies directly to LED displays used in transportation, advertising, and public information systems.
From a manufacturing perspective, bonding material selection directly influences maintenance frequency. Stable bonding connections reduce service calls, while unstable bonding increases repair cycles. Understanding this relationship allows procurement managers to forecast long-term operational cost more accurately
Initial Manufacturing Cost Difference
Gold bonding increases material cost because gold is significantly more expensive than copper, but the difference in total display price is smaller than most buyers expect. Bonding wire typically represents a small portion of overall LED module cost, yet it plays a disproportionate role in reliability.
Commodity pricing data published by the London Metal Exchange (LME) shows that gold costs substantially more per kilogram than copper. However, LED bonding wire uses extremely small quantities of metal, which limits the direct impact on final product price. In most commercial LED modules, bonding material contributes less than 3% of total module manufacturing cost.
The perceived price difference often appears larger because premium bonding materials are frequently bundled with higher-grade LED chips and stricter quality control processes. Buyers sometimes attribute the entire price difference to bonding material rather than to overall manufacturing standards.
The table below illustrates typical cost differences between bonding materials in commercial LED modules.
| Cost Component | Gold Bonding | Copper Bonding | Cost Impact on Project |
| Raw material cost | Higher | Lower | Moderate |
| Manufacturing precision requirement | Standard | Higher | Moderate |
| Quality control requirement | Standard | Higher | Moderate |
| Final module price difference | +3% to +8% | Baseline | Limited |
| Reliability risk cost | Low | Moderate | Significant |
Procurement teams should evaluate price difference relative to project scale. In a 100-square-meter outdoor LED display, the bonding material upgrade from copper to gold typically increases total hardware cost by less than the cost of a single maintenance intervention. This relationship becomes especially relevant in installations where maintenance access requires specialized equipment.
From our production cost analysis, the most accurate pricing comparison focuses on system-level cost rather than component-level cost. When bonding reliability improves, service frequency decreases, and long-term cost stabilizes.
Maintenance and Repair Cost Over Time
Maintenance cost represents the largest variable expense in long-term LED display operation. Bonding reliability directly affects how often technicians must replace modules or repair pixel failures. Each maintenance event introduces labor cost, equipment cost, and operational disruption.
Most service contracts calculate maintenance cost using three primary factors:
- Frequency of failure
• Time required for repair
• Operational interruption cost
The following table summarizes typical maintenance expenses associated with bonding reliability.
| Maintenance Factor | Gold Bonding | Copper Bonding | Financial Impact |
| Average service interval | Longer | Shorter | Predictable scheduling |
| Module replacement frequency | Low | Moderate | Increased material cost |
| Technician labor hours | Lower | Higher | Increased labor cost |
| Equipment rental requirement | Less frequent | More frequent | Higher operating cost |
| Risk of emergency repair | Low | Moderate | Operational disruption |
We also observe that maintenance frequency increases rapidly after bonding fatigue reaches a critical threshold. Once failure rate rises beyond approximately 0.3% of pixels per year, service demand accelerates and maintenance cost becomes unpredictable.
Total Cost of Ownership (TCO)
Total cost of ownership provides the most accurate financial evaluation of bonding material selection because it includes both initial investment and long-term operating expenses. TCO analysis helps procurement managers compare different technical options using measurable economic outcomes.
A complete TCO model includes:
- Hardware purchase price
• Installation cost
• Energy consumption
• Maintenance labor
• Replacement components
• Operational downtime
Each component contributes to overall project cost. Bonding reliability influences several of these factors simultaneously, particularly maintenance and downtime.
The table below presents a simplified seven-year TCO comparison for a commercial outdoor LED display operating 18 hours per day.
| Cost Category | Gold Bonding | Copper Bonding |
| Initial hardware cost | Higher | Lower |
| Scheduled maintenance cost | Lower | Moderate |
| Unscheduled repair cost | Low | Moderate |
| Replacement module cost | Low | Moderate |
| Operational downtime cost | Low | Moderate |
| Total 7-year cost trend | Stable | Increasing |
Financial modeling guidelines published by the International Organization for Standardization (ISO 15686) emphasize that lifecycle cost analysis should consider maintenance frequency and replacement intervals when evaluating infrastructure investments. This approach ensures that procurement decisions reflect long-term financial performance rather than short-term budget constraints.
From our project evaluations, displays operating in high-duty environments often achieve lower total cost when reliability is prioritized over initial price. This pattern appears consistently in transportation systems, stadium displays, and outdoor advertising networks.
A practical rule derived from lifecycle analysis is that reliability improvements reducing maintenance frequency by even 10% can offset the initial cost difference between bonding materials within the first three years of operation.
We do not recommend selecting bonding material based solely on purchase price for installations operating more than 16 hours per day. In these scenarios, maintenance and downtime risk dominate financial performance. Buyers should prioritize predictable reliability rather than minimal upfront cost.
AIO Block — Cost Comparison
Conclusion:
Copper bonding reduces initial purchase cost, but gold bonding often lowers total lifecycle cost in high-usage or harsh environments.
| Cost Factor | Gold Bonding | Copper Bonding |
| Initial Cost | Higher | Lower |
| Maintenance Frequency | Low | Moderate |
| Risk of Pixel Failure | Low | Moderate |
| Downtime Risk | Low | Moderate |
| Total Cost Over 7 Years | Often lower | Often higher |
Our Edge
- Field service records show maintenance cost can increase by 20–35% when bonding reliability is inconsistent across production batches.
• The most expensive failure is typically operational downtime rather than hardware replacement, especially in advertising installations generating hourly revenue.
• Projects operating above 16 hours per day benefit from reliability-focused design because reduced service frequency stabilizes long-term operating cost.

Conclusion
Gold vs copper bonding in LED displays is not just a material choice but a critical factor in system reliability and lifecycle cost. Projects that evaluate bonding technology based on real operating conditions, environmental exposure, and duty cycles achieve more stable performance and lower maintenance frequency. In demanding environments like outdoor billboards, transportation systems, and stadiums, reliable bonding directly reduces downtime and ensures consistent operation. Prioritizing long-term reliability over initial cost helps procurement teams achieve better total cost of ownership within the first few years.
If you are planning an LED display project and need expert guidance, contact NSELED to review your application requirements and bonding reliability options. Our technical team will help you select the right configuration based on your environment, reduce operational risk, and ensure long-term performance and